Introduction
During this tutorial you will be introduced to the EDGE bioinformatics webserver and how it may be used for analyzing next generation sequencing data from single samples, populations, 16S studies and metagenomes.
EDGE publication - (https://academic.oup.com/nar/article/45/1/67/2572059/Enabling-the-democratization-of-the-genomics)
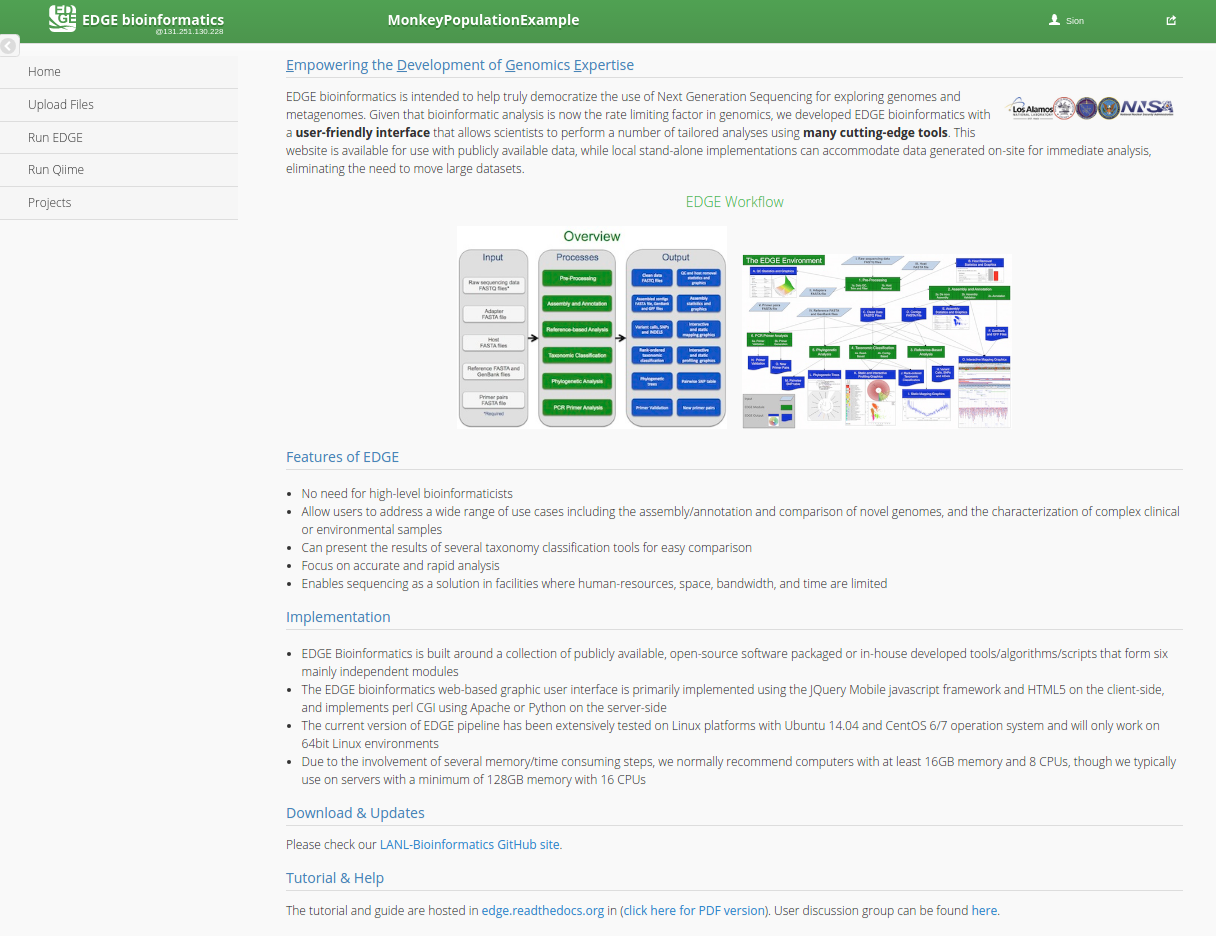
EDGE provides a user interface that provides a convenient way to utilize cutting-edge bioinformatics software in an accessible manner (https://bioedge.lanl.gov/edge_ui/). EDGE can be run locally using a command-line interface or as an interactive webserver. The tutorial will focus on using the webserver user-interface.
EDGE provides a number of useful bioinformatics workflows that can be separated into two main catagories:
A) EDGE: Pre-processing → Assembly → Annotation → Taxonomy/Phylogeny/Virulence/ABR gene profiling.
B) QIIME: Metagenomic OTU classification and analysis.
Accessing the EDGE server
There is an EDGE server running on the CLIMB infrastructure.
It can be accessed using your web browser.
Navigate to edge.climb.ac.uk
Click on the user icon on the top right hand corner of the webpage.
Create an account → this will allow you to upload files to the webserver and run jobs.
Workshop Examples
For the purposes of this workshop we will not be uploading or processing any example files (due to time constraints and server load). However, a number of pre-processed datasets have been made available. The outputs of these projects can be browsed publicly and explored as example outputs from EDGE:
- Population Genomics
Project Name : Monkey Population Example (GambiaMonkeyStudy)
A novel clade of S. aureus was identified from Green Vervet monkeys in The Gambia by WGS.
Note: This section also contains a tutorial on how to run EDGE.
- Metagenome Misidentification or “Plague on the subway”
Project Name: Subway Sample (PlagueOnTheSubway)
Link: EDGE Tutorial: Plague on the Subway
A New York subway metagenome sample was mistakenly identified the presence of anthrax and plague.
Accessing Projects
Click on the Projects tab on the left hand side of the screen.
Select the appropriate Project from the drop-down list.
Project 1 - Population Genomics
The genomes in this section were taken from the publication - “Transmission of Staphylococcus aureus from Humans to Green Monkeys in The Gambia as Revealed by Whole-Genome Sequencing.” (http://aem.asm.org/content/82/19/5910.long)
Study Aims
Staphylococcus aureus is a gram-positive, commensal bacteria which is also an opportunist pathogen. S. aureus is a problem pathogen in the hospital setting, due largely to its acquisition of broad resistance to antibiotics. In this study S. aureus isolates were collected from both rural and urban Green Vervet monkeys from the Gambia. Samples were also collected from human infections in hospitals from the same region. A number of questions were posed including, is there evidence for human to monkey transmission or vice-versa, was the S. aureus infecting monkeys distinct from human isolates and was there any evidence of antibiotic resistance in monkey associated S. aureus.
Data
Five genomes (F8, F12, H2, H8 and H10), one from each of the sub clades of the novel monkey-associated clade, were selected as representative samples. These were assembled and annotated. H10 was then assembled and annotated using EDGE and a phylogenetic tree was produced which included a number of S. aureus reference genomes from the NCBI database and including the 4 additional monkey-associated isolates.
Raw read files for H10 were downloaded from the ENA - http://www.ebi.ac.uk/ena/data/view/ERX1285965
The other samples from the study can be found here - http://www.ebi.ac.uk/ena/data/view/PRJEB12419
Uploading Files
Note: Do not download and upload files during the tutorial due to time constraints. Feel free to do so after the workshop.
Click on the Upload files tab on the left hand side of the screen.
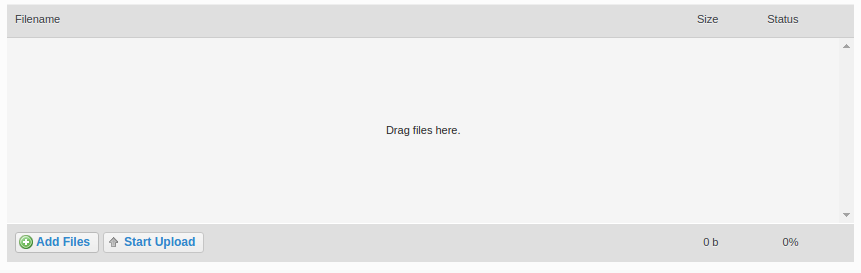
Either:
A) Drag and drop files onto the centre panel.
B) Click “Add Files” and select the appropriate files.
Click “Start Upload”
The progress bar and % indicator will give you feedback on how much of the task is completed.
Running EDGE
Click the “Run EDGE” tab on the left hand side of the screen.
This will bring up a number of drop-down boxes that contain separate steps in the workflow.

Input Raw Reads
The first step should be to select the sample (or samples) to process in the “Input Raw Reads” menu. In order to process files that have been uploaded by the user then then appropriate files have to be selected in the section underneath “Sequencing Reads”. Alternatively a sample from the NCBI’s Short Read Archive can be input by toggling the “Input from NCBI Sequence Reads Archive (SRA)” button.
Note: The number of cores/processes to use for each step can be increased by “additional options” at the bottom of the “Input Raw Reads” box.
Note: Config files can also be used to reuse parameters that have been previously selected in “additional options”.
Sample Preprocessing
This section contains a number of read trimming and filtering options. Additionally if there is know contamination from a host/source then reads that map to sources of contamination can be removed as this stage. Having filtered, high-quality reads with little to no contamination will produce better assemblies.
The majority of the default options should be suitable for most analyses, although the Trim Quality Level should be increased.
Example:
For sample H10 - Trim Quality Level was increased to 20.
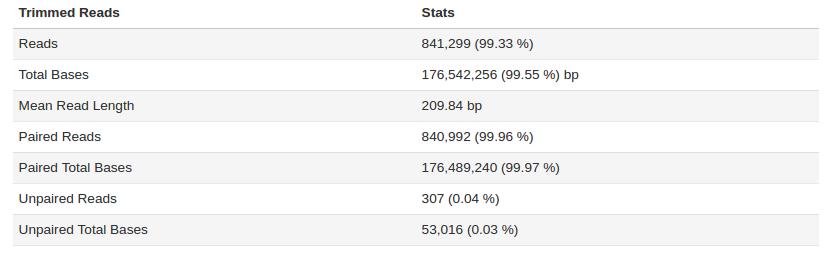
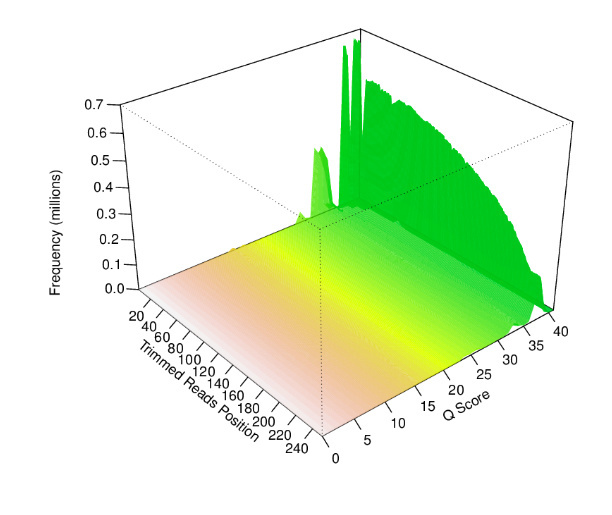
The sample fastq was from a good quality sequencing run (250bp PE, Nextera Library Prep). After filtering and trimming >99% of the reads passed our quality thresholds with a mean read length of > 200bp. Additional statistic can be found by clicking on Full QC Report link at the bottom of the tab.
EDGE also produces a number of useful figures for visualizing each step. For example, the quality length and number of reads after filtering can be seen below.
Assembly and Annotation
Assembly
Assemblers are software that will take short or long NGS reads and attempt to reconstruct the underlying DNA sequence.
EDGE contains three assemblers: UDBA-UG , SPAdes and MEGAHIT. UDBA-UG and SPAdes are suitable for assembly of single samples. MEGAHIT is for metagenome assembly.
The trimmed reads are also mapped back to the assembled genome as a quality control check. The higher % of reads that were used in the assembly the better. Lower % likely indicate sample contamination or poor assembly.
Example:
SPAdes is currently the most popular assembler for bacterial genomics. It was selected as the assembler of choice for sample H10. This produced:
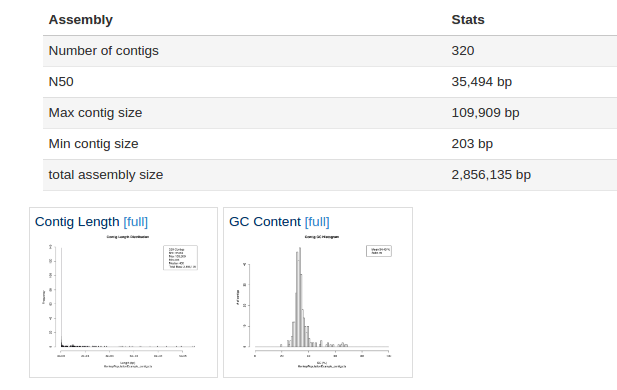
As we can see form the report 320 contigs (contiguous DNA sequences) were produced by SPAdes, the largest of which was ~100 kbp. For S. aureus that is a poor assembly, we would typically see ~40-120 contigs. The assembly might be worth repeating with more stringent filtering parameters. However the assembly size and GC content is about right for S. aureus at 2.8 Mbp and ~32% GC.
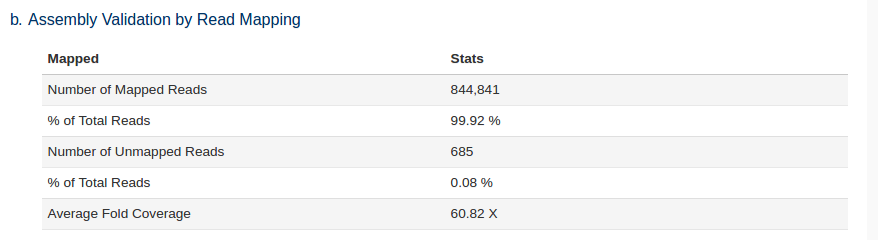
We can see that a large number of reads mapped back to the assembly i.e. the majority of our reads were used in the assembly.
A useful way of visualizing contigs is to look at their coverage vs GC content:

This shows us that there are a large number of smaller contigs that have <10x read coverage.
Questions:
-
What is the expected GC content of S. aureus? What does the GC content vs Coverage plot tell us about the large number of contigs produced by the assembly of H10?
-
If we were going to repeat the assembly step what changes or filters might we apply to the reads or assembly to get a better output for downstream analysis?
Annotation
Annotation can be performed in two way using EDGE. Automated predication and annotation using PROKKA or transferring existing annotation from a reference genome using RATT. RATT would be suitable for studies looking at highly clonal isolates with a closely related reference genome. PROKKA is suitable for predicting ORFs in bacterial assemblies and provides good reference databases tailored to well-studied organisms.
Example:
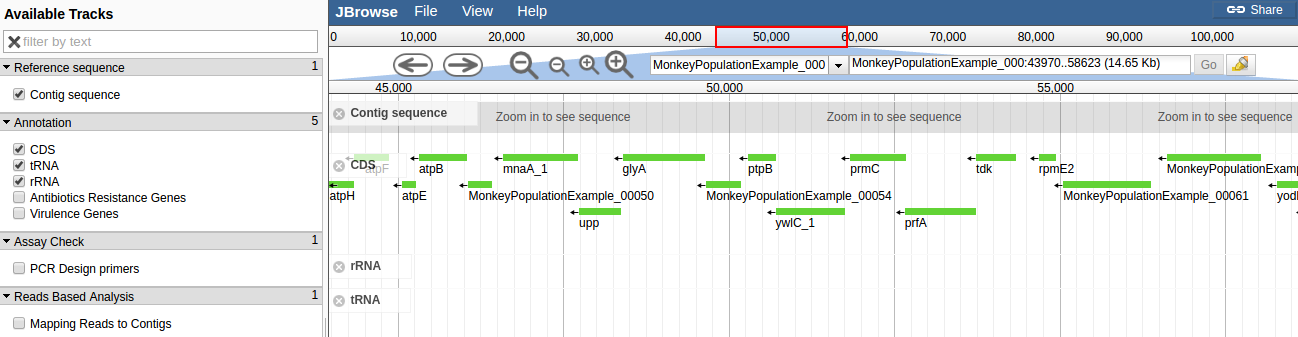
H10 was annotated using PROKKA. Contigs below 500 bp were filtered and removed before annotation. There were 2,584 CDS. The assembly and annotation can be browsed using JBrowse:
Reference Based Analysis
Aligning of trimmed reads to one or more reference genomes is commonly used for calling high confidence variants. It is commonly referred to as ‘mapping’. Bases that are consistently different in reads relative to the reference genomes are called as SNPs.
EDGE supports two read aligners, Bowtie and BWA-mem. BWA-mem was chosen for H10 (personal preference).
Contigs can also be aligned to the same reference genomes. A low percentage of aligning contigs would indicate either contamination or a large amount of novel or divergent sequence.
Example:
Under the reads mapped to reference tab the USA300 reference has higher base coverage (87.98%) than the EMRSA15 reference genome, HO 5096 0412, that was used in the paper (77.92%). However, HO 5096 0412 has a marginally higher coverage when the contigs are used. Overall, USA300 is more suitable as a reference genome than HO 5096 0412 for this sample. A list of variants relative to the reference can be downloaded or viewed in JBrowser.
Questions:
- Staphylococcal chromosomal cassette (SCCmec) is a resistance cassette of genes in Staphylococcal spp. In the drop down menu at the top of JBrowse select ‘NC_017763’. Click the “”mapping reads to contigs” button and zoom in until you can see individual reads mapped onto the genome. Navigate to the co-ordinates of mecA, the gene that characterises SCCmec. MecA is at base pair positions 39734…41743. What observations can you make about the distribution of reads in and around this gene region. What does this mean for H10?
Taxonomic Classification
A number of databases have been instituted in EDGE. These cover identification and classification of genus/species from read data (Kraken/BWA) or contigs (Kraken). There are also virus databases for viral samples and phage elements in bacterial samples (GOTTCHA-virus).
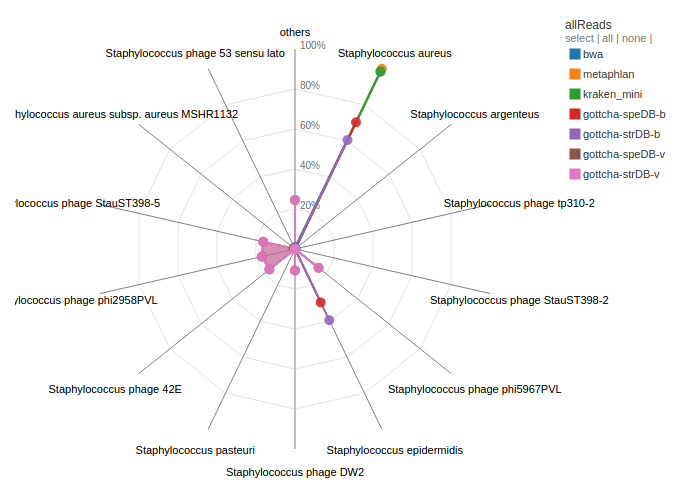
Example:
Contigs and reads from H10 were aligned to all available databases by a number of tools. H10 was identified as Staphylococcus aureus by a number of tools. There were also contigs/reads that were identified as other Staphylococcal and unrelated species. A number of reads/contigs are also identified as being from previously identified Stayphylococcal phages.
Questions:
-
H10 was identified as predominantly Staphylococcus aureus by a number of tools and databases. However, what is the other Staphylococcal species that is also identified from the reads/contigs. What might this mean for the sample or study?
-
What is the second largest grouping from the contig assignment analysis? Discuss the implications of this?
Phylogenetic Analysis
EDGE can produce phylogenetic trees of the sample of interest compared to preexisting datasets for a limited number of species. Alternatively, the user can select genomes from the NCBI or provide up to 5 genebank or fasta files. SNPs are then called by aligning the assemblies to a reference genome (designated by the user or randomly selected). These SNPs are then passed to either FASTTREE (quick and dirty) or RaxML (slow and clean) to produce a phylogenetic tree.
Example:
Four other previously assembled monkey-associated clade isolates from Senghore et al., 2016 were included alongside H10 and a large number of reference genomes from the NCBI to produce a phylogenetic tree using FastTree.

Questions:
-
Where do the monkey-associated isolates cluster on the tree? What does this mean for transmission between S. aureus between humans and monkeys?
-
How diverse are the monkey associated S. aureus isolates?
-
The positioning of H10 within the tree is subtly different when using reads or using contigs. What does are the implications of this?
Specialty Gene Profiling
EDGE checks genes from samples against a number of different curated databases of genes that have been previously identified as being involved in virulence and antibiotic resistance. The trimmed reads and annotated ORFs can be check against these databases to identify genes of interest.
Example:
A number of genes were identified in H10 that have previously been implicated in virulence and AMR. Many of these genes were involved in adhesion, immune evasion etc. These are good candidate genes for host adaptation or competition with other constituents of the Green Vervet skin and nasal microbiota.
Explore the lists of specialty genes.
Questions:
-
Are any gene involved in AMR in H10? What would you conclude about the resistance profile of H10 from this list of genes, i.e. is it resistant to any antibiotics?
-
Check the original publication. The authors test the samples using AMR testing in the lab. Was H10 identified as sensitive or resistant? How does this compare to the EDGE analysis and what doe this mean?