Plague on the subway! (?)
Quote (https://read-lab-confederation.github.io/nyc-subway-anthrax-study/):
“In February 2015 Chris Mason and his team published an in-depth analysis of metagenomic data (environmental shotgun DNA sequence) from samples isolated from public surfaces in the New York City (NYC) subway system. Along with a ton of really interesting findings, the authors claimed to have detected DNA from the bacterial biothreat pathogens Bacillus anthracis (which causes anthrax) and Yersinia pestis (causes plague) in some of the samples. This predictably led to a huge interest from the press and scientists on social media. The authors followed up with an re-analysis of the data on microbe.net, where they showed some results that suggested the tools that they were using for species identification overcalled anthrax and plague.”
Here we replicate some of this re-analysis using EDGE.
The EDGE server hosted on CLIMB can be found at: https://edge.climb.ac.uk/
EDGE public Project Name - PlagueOnTheSubway
Original Paper - http://www.sciencedirect.com/science/article/pii/S2405471215000022
For a full and very readable overview of the re-analysis please read - https://read-lab-confederation.github.io/nyc-subway-anthrax-study/
Sample SRR1748708 was selected as it had been previously identified as containing Bacillus anthracis.
Analysis
SRR1748708 was mapped to the B. cereus (a non-pathogenic but common relative of B. anthracis) and a B. anthracis reference genome containing two virulence plasmids pXO1 and pXO2. Without either of these plasmids B. anthracis is considered attenuated.
The sample was downloaded directly from the Short read archive by EDGE. Reads were trimmed and filtered using default parameters except the quality threshold was set to a phred score of 20. The filtered reads were then mapped to each of the reference genomes using BWA-mem.
Results
The results of the mapping based analysis can be viewed in the project under the ‘Reference Based Mapping’ tab. The line plot of NGS read coverage along the length of the reference genome is very intuitive and understandable. There is one plot for each reference sequence.
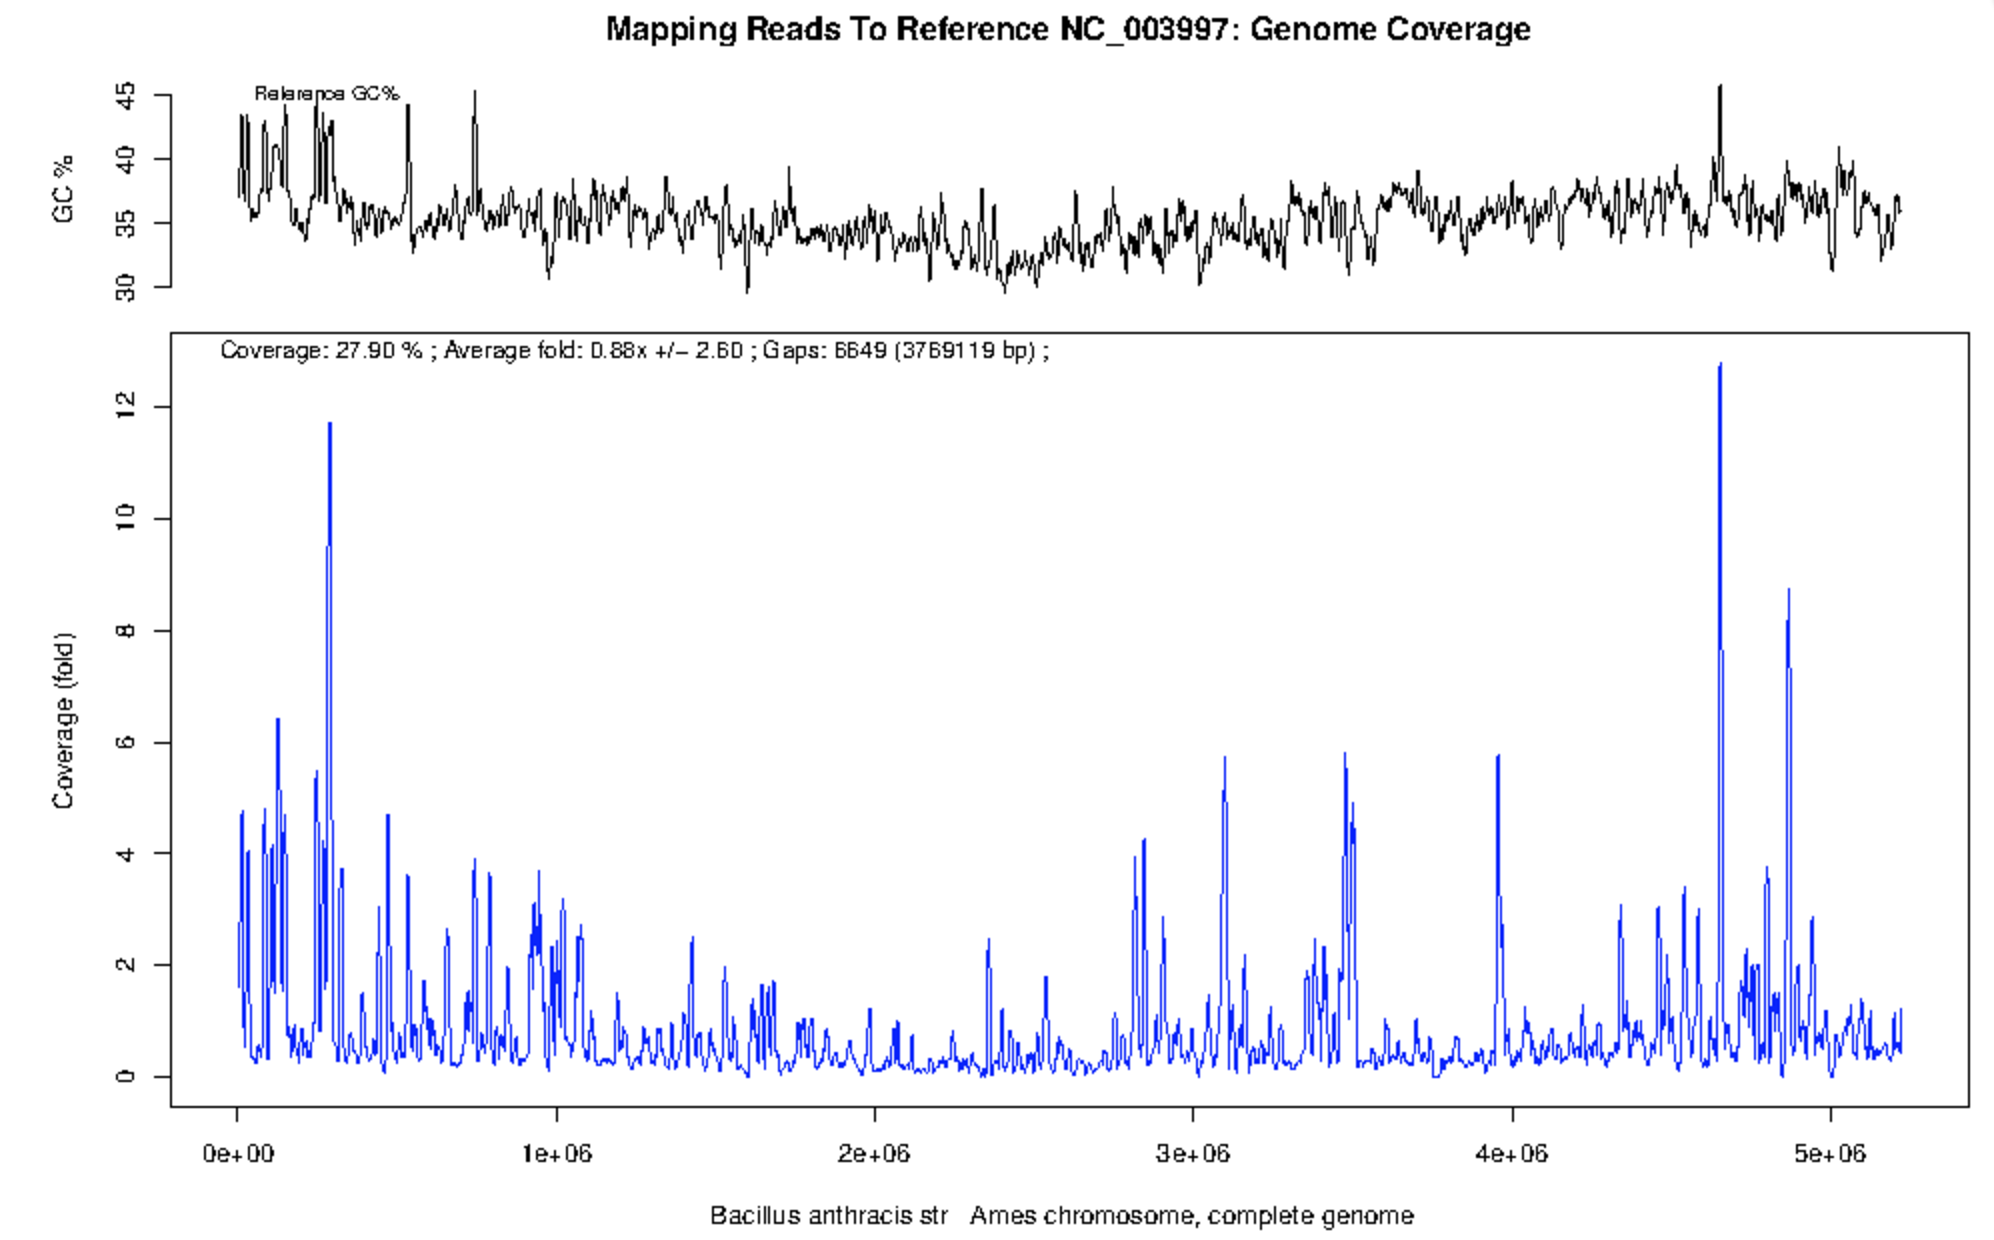
There is some read mapping, 0.88x coverage of 28% of the genome, to B. anthracis. However, on inspection of the figure the majority of the coverage in in regions of high GC content, a classical indication of horizontally acquired genomic islands or highly conserved rRNA genes. The large amount of mapping is likely from rRNA gene from other bacterial species or related mobile genetic elements.
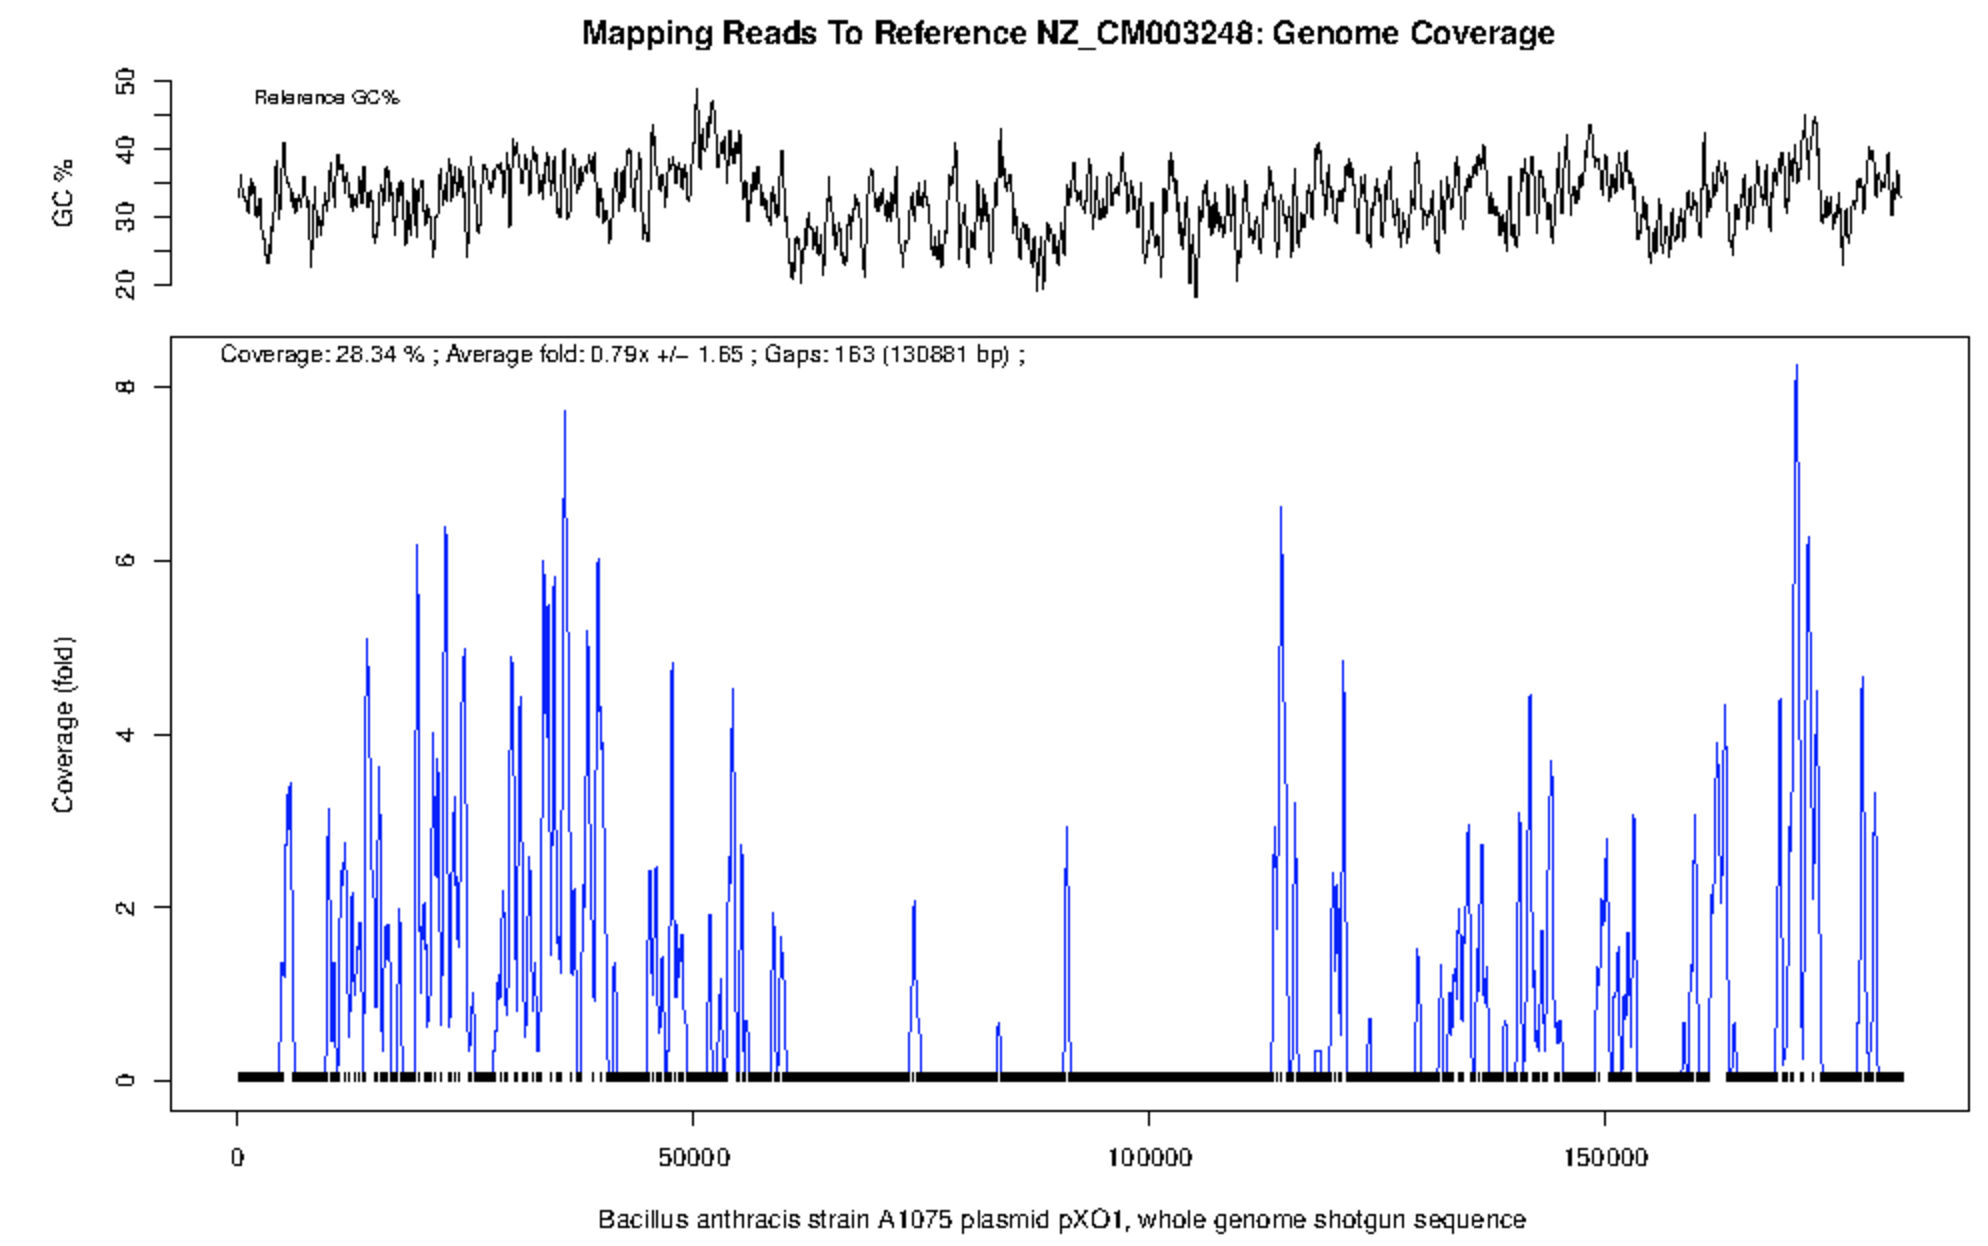
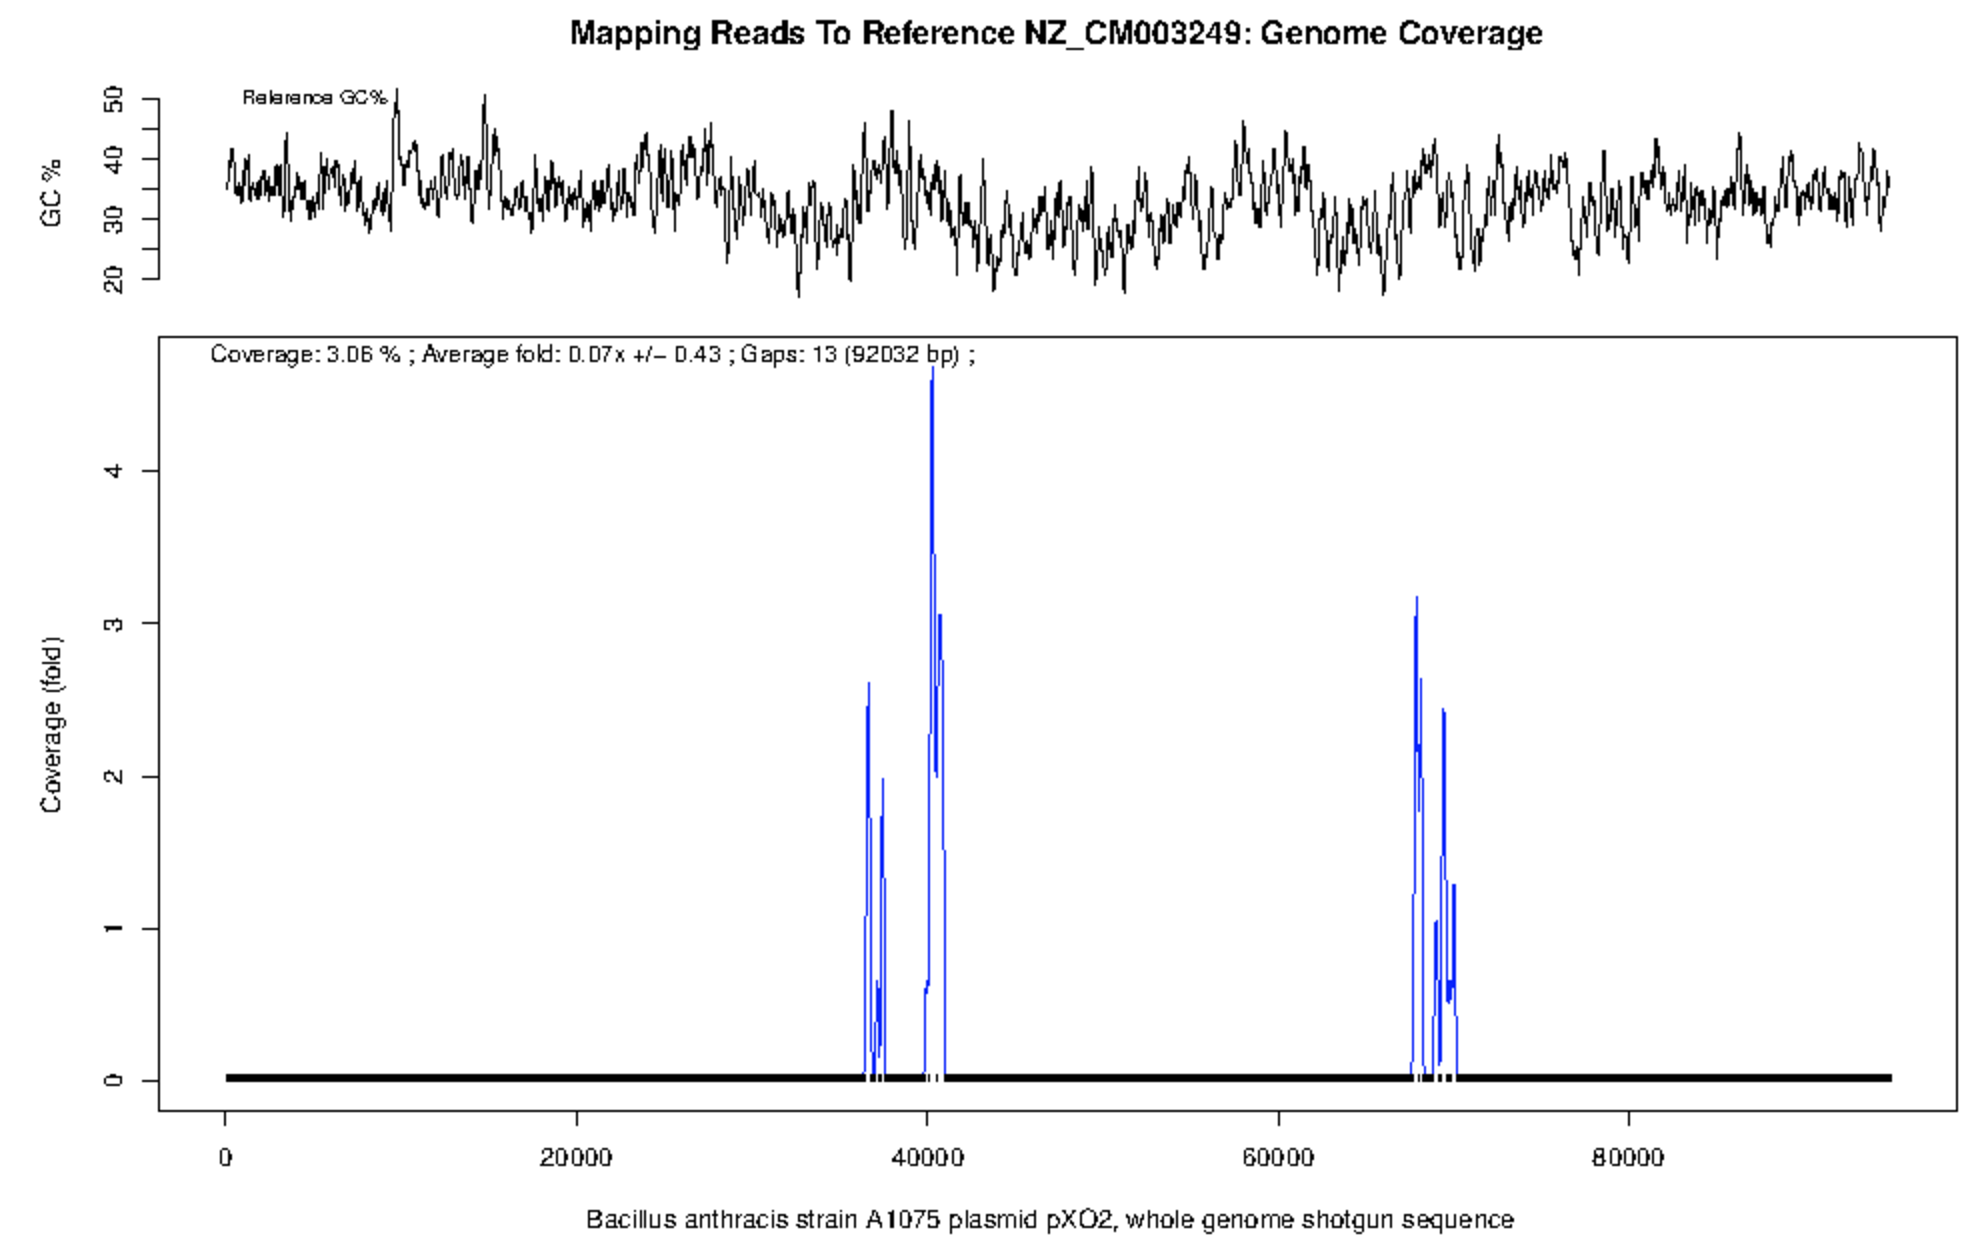
There is further evidence for a lack of B. anthracis on inspection of the plots for pXO1 and pXO2 (below). There is only intermittent coverage (28% at <1x depth and 3% coverage at <0.5x depth) across these sequences and what little coverage does occur is present in peaks and troughs. Perhaps these are low complexity regions or conserved motifs?
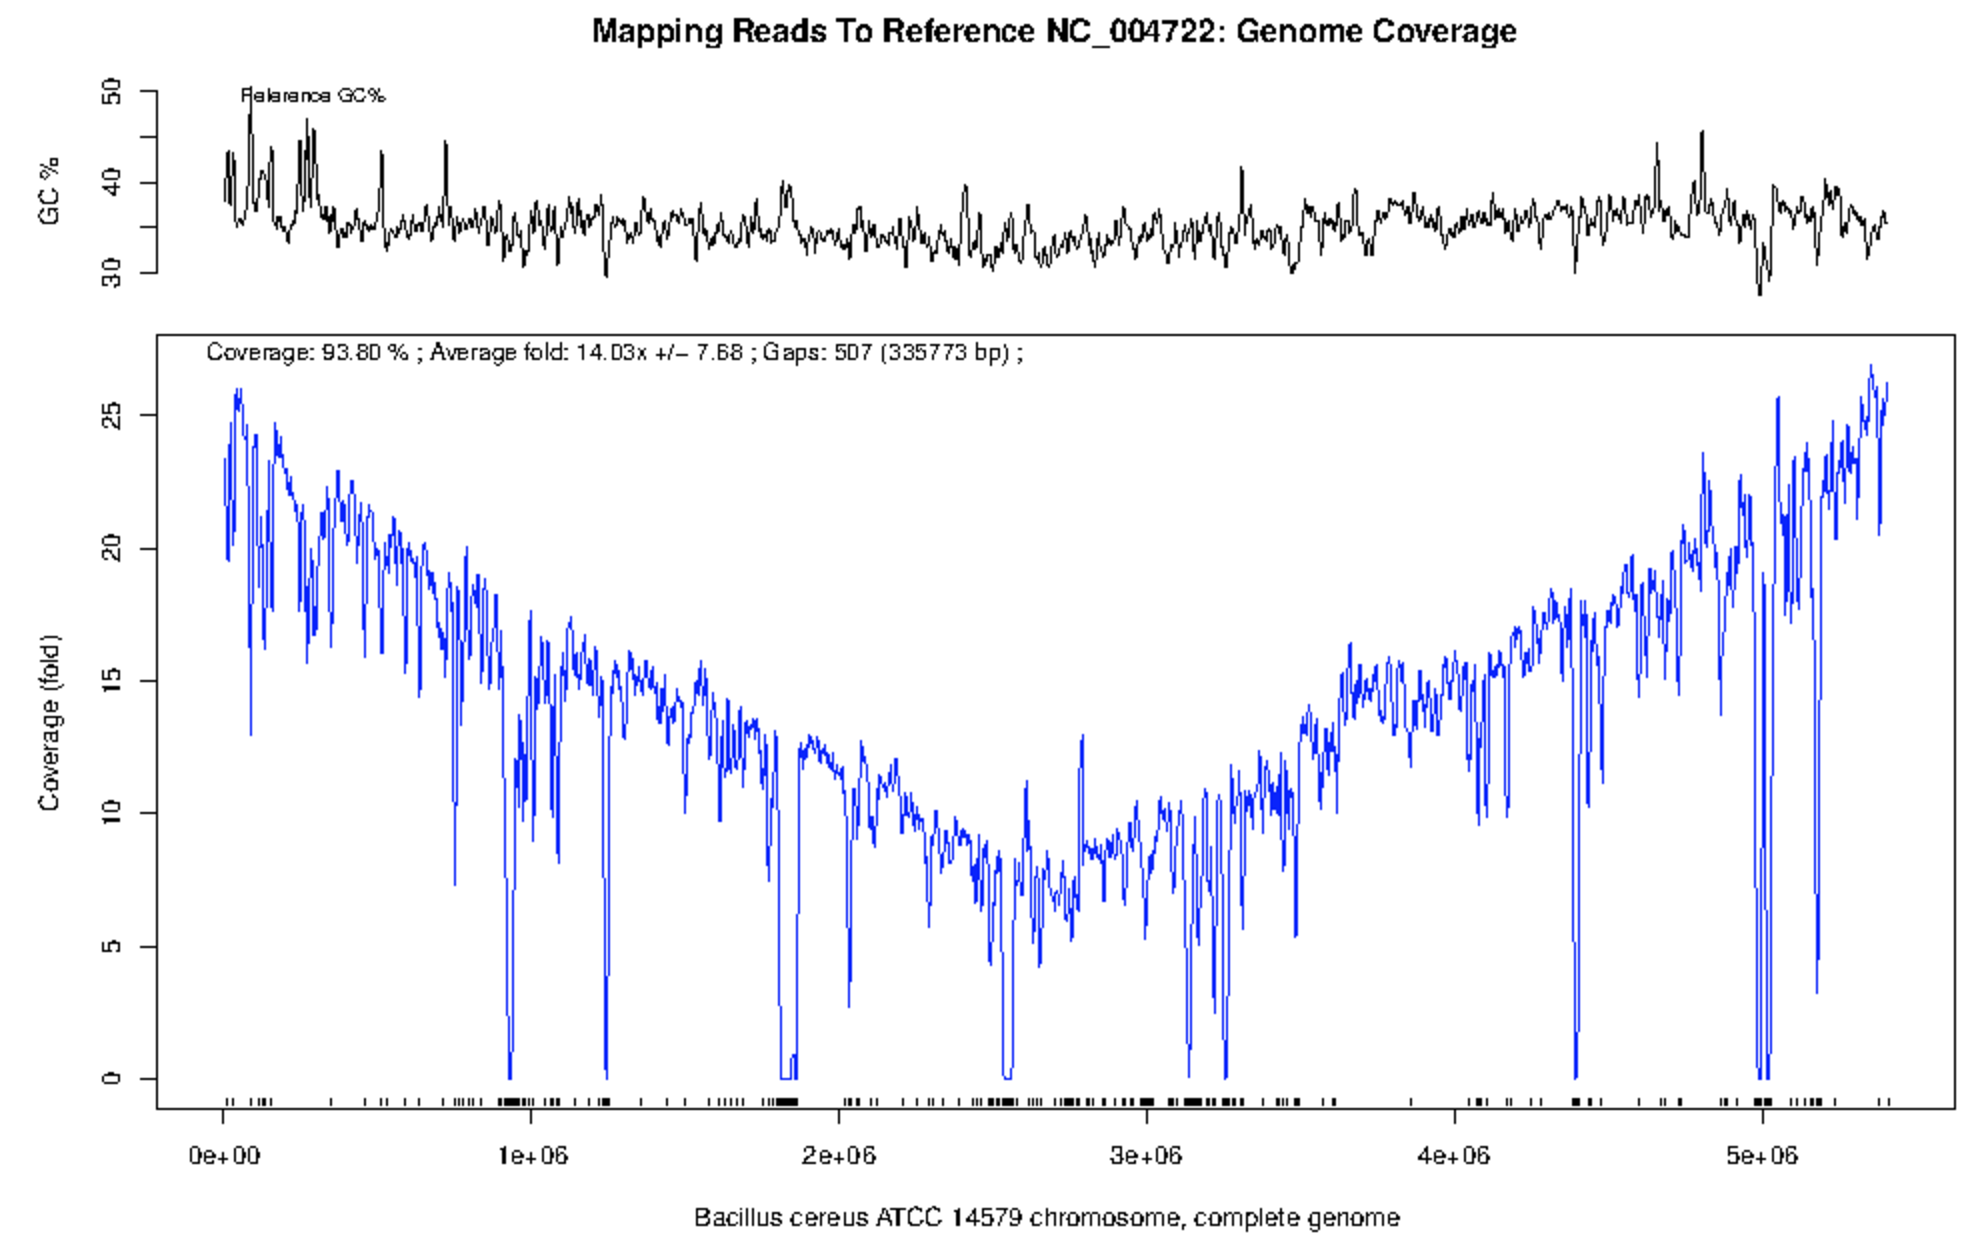
When we observe the plot of B. cereus (below) it is clear that there is compelling evidence for the presence of B. cereus rather than B. anthracis. Over 90% of the genome is covered in reads for an average coverage of 42x read depth.